MORE than 13,500 crimes have been reported across Torbay in the past year.
This information is courtesy of Herald Express. Read the full article here.
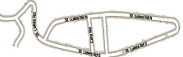
An up-to-date crime map using police logs reveals which areas had the most reported criminal incidents. Each dot on the map represents one of the 13,500 reported crimes.
Zoom in on this map and click the dots to discover the crimes reported in YOUR street.
Types of crime reported in Torbay since October 2014:
| Anti-Social Behaviour | 5,014 |
| Violence and Sexual Offences | 2,922 |
| Criminal Damage and Arson | 1,250 |
| ‘Other Theft’ | 1,051 |
| Shoplifting | 897 |
| Burglary | 643 |
| Vehicle Crime | 488 |
| Public Order | 480 |
| Drugs | 381 |
| Suspect Charged | 318 |
| Offender Sent to Prison | 261 |
| ‘Other crime’ | 119 |
| Theft from the Person | 88 |
| Bicycle Theft | 73 |
| Possession of Weapons | 53 |
| Robbery | 53 |
| Total | 13,512 |
These are the outcomes of the reported crimes
| Anti-Social Behaviour – No Outcome Recorded | 5,014 |
| Investigation complete – no suspect identified | 2,975 |
| Unable to prosecute suspect | 2,002 |
| Under investigation | 1,290 |
| Local resolution | 348 |
| Offender given a Caution | 286 |
| Offender given Community Sentence | 213 |
| Offender Fined | 127 |
| Defendant found Not Guilty | 103 |
| Offender given Conditional Discharge | 89 |
| Offender given a Drugs Possession Warning | 83 |
| Court case unable to proceed | 80 |
| Court result unavailable | 74 |
| Suspect charged as part of another case | 66 |
| Offender given Suspended Prison Sentence | 64 |
| Offender given Penalty Notice | 35 |
| Offender ordered to pay Compensation | 26 |
| Formal action is not in the Public Interest | 24 |
| Offender otherwise dealt with | 21 |
| Defendant sent to Crown Court | 7 |
| Offender deprived of property | 6 |
All figures supplied by police.co.uk
